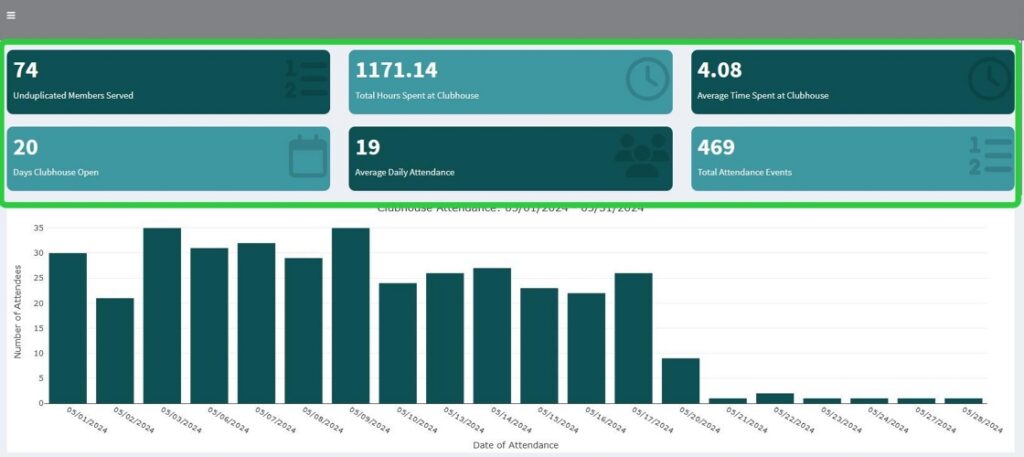
The Value Boxes are designed to give you quick, “At a Glance” views of common statistics about your clubhouse. They will update with each filter you apply.
Please Note:
This tutorial was generated on a demo server, using fake data. Because of this some items might not show typical data that you would expect to see on your own servers. The goal of this tutorial is just to show you how the different options work in Flourish.
Date Ranges and Single Dates #
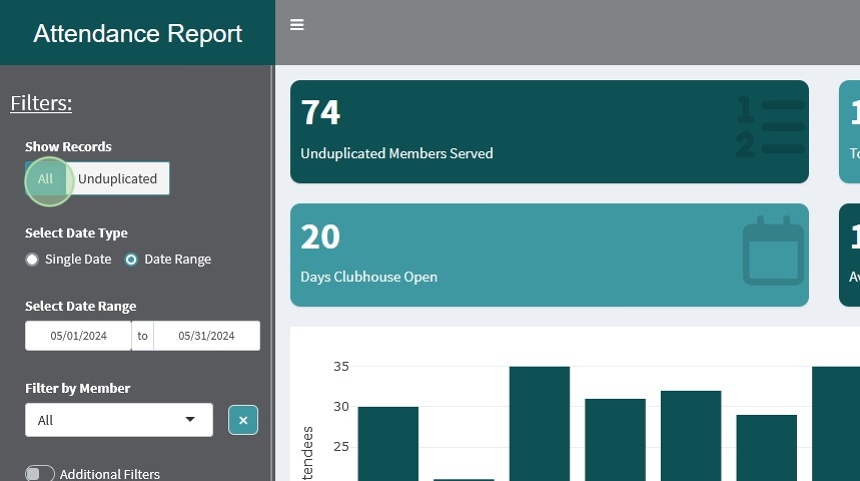
The Attendance Report will default to a date range of the most recent full month.
For example, if I’m running a report in June, the default dates will be May 1 to May 31
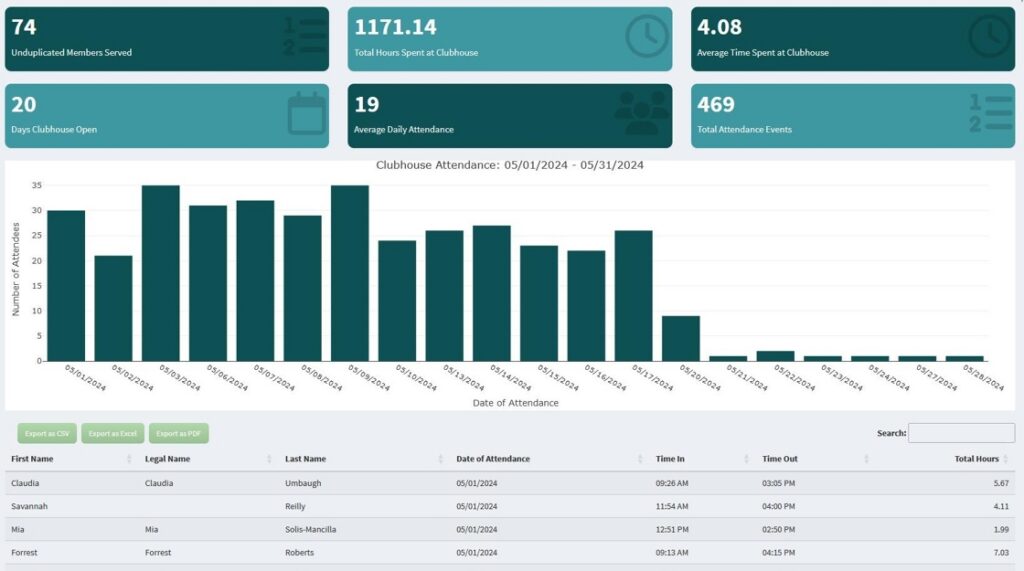
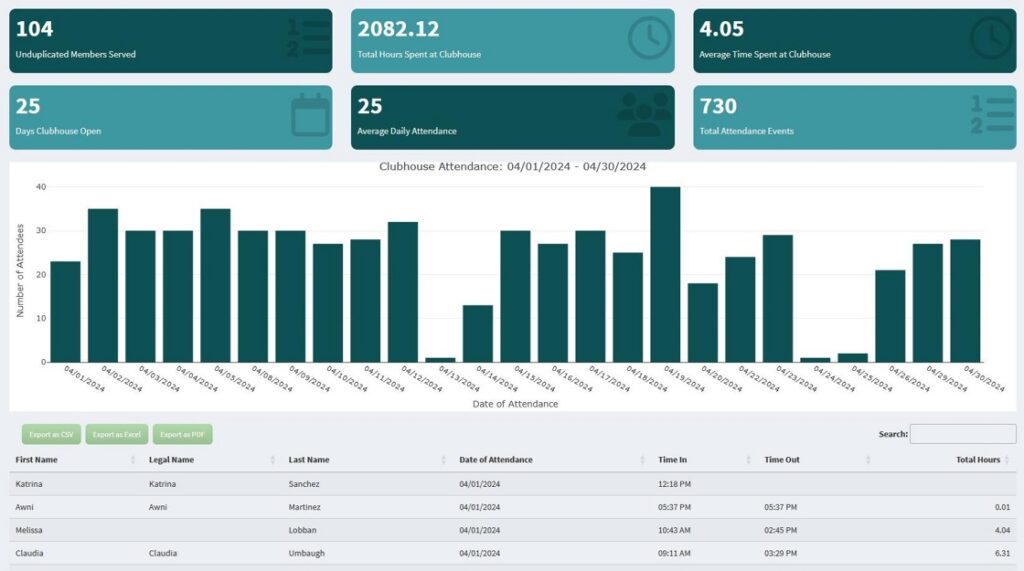
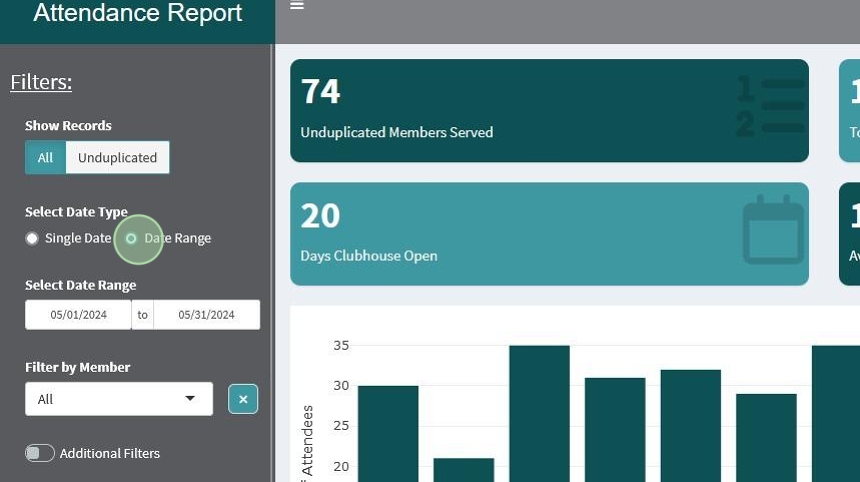
Here is an example of what the page might look like upon initial load
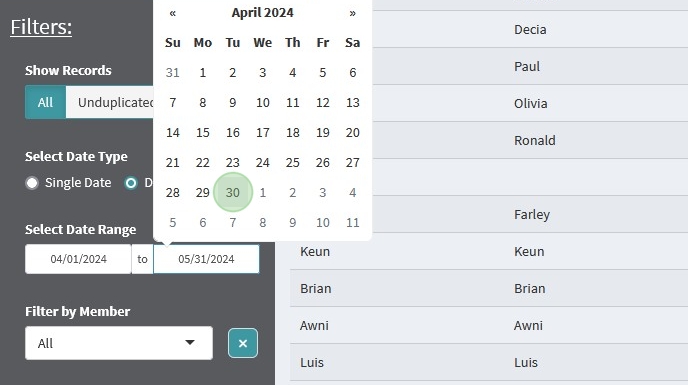
To Change the date range, simply click on each end of the range and use the calendar picker to update the dates

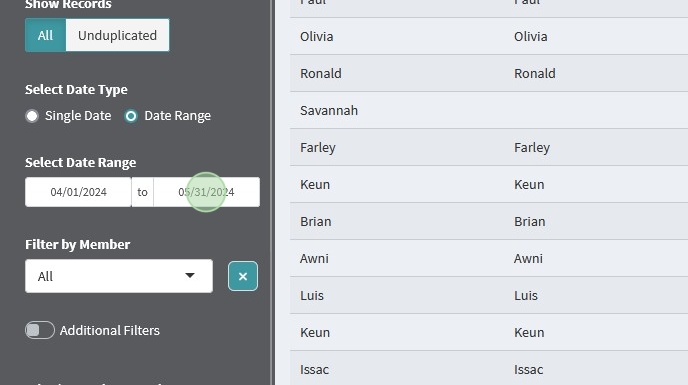
The table, value boxes, and attendance chart will all automatically update to show you the results of your selections.
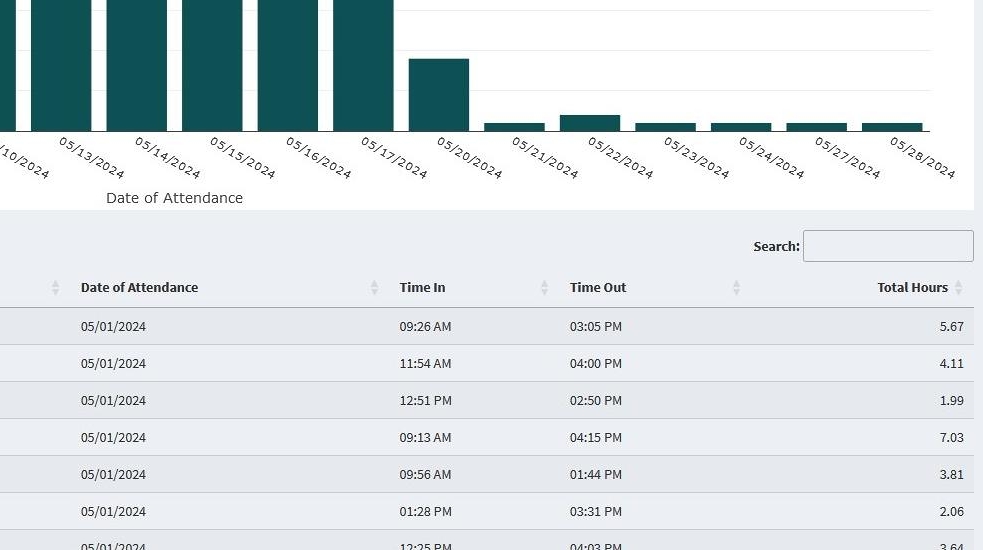
Date Range will have its own unique columns associated with it.
The unique columns shown for Date Range are:
- Date of Attendance
- Time In
- Time Out
- Total Hours
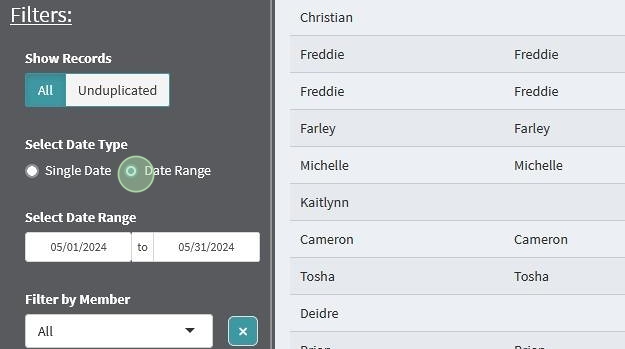
Alternatively, you have the option to look at just a single date.
Start by clicking “Single Date”
The date will default to the current date
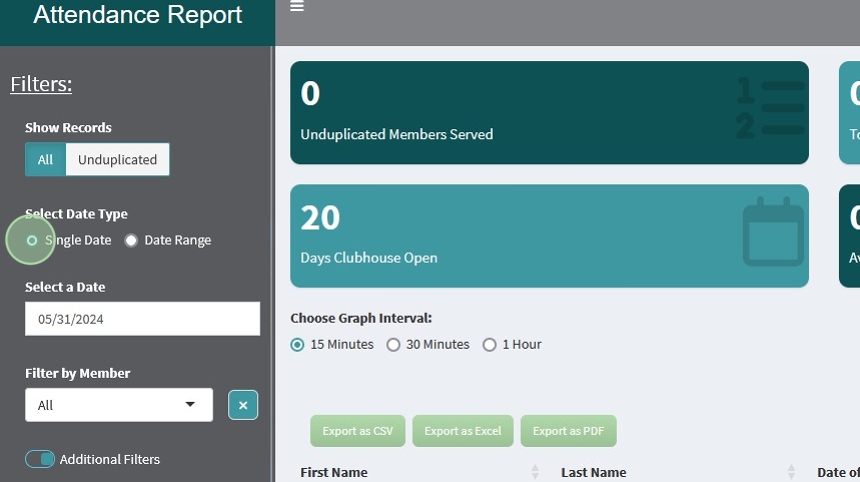
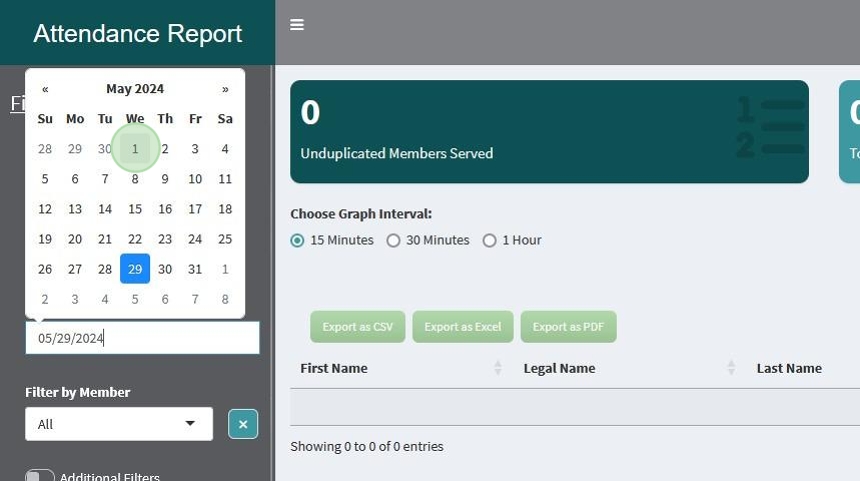
Click on the date bar and use the date picker to choose the single date you would like to see records for
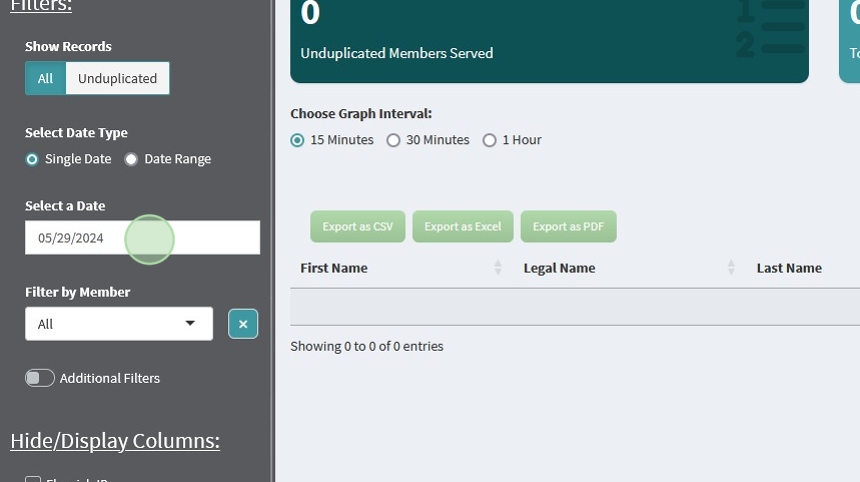
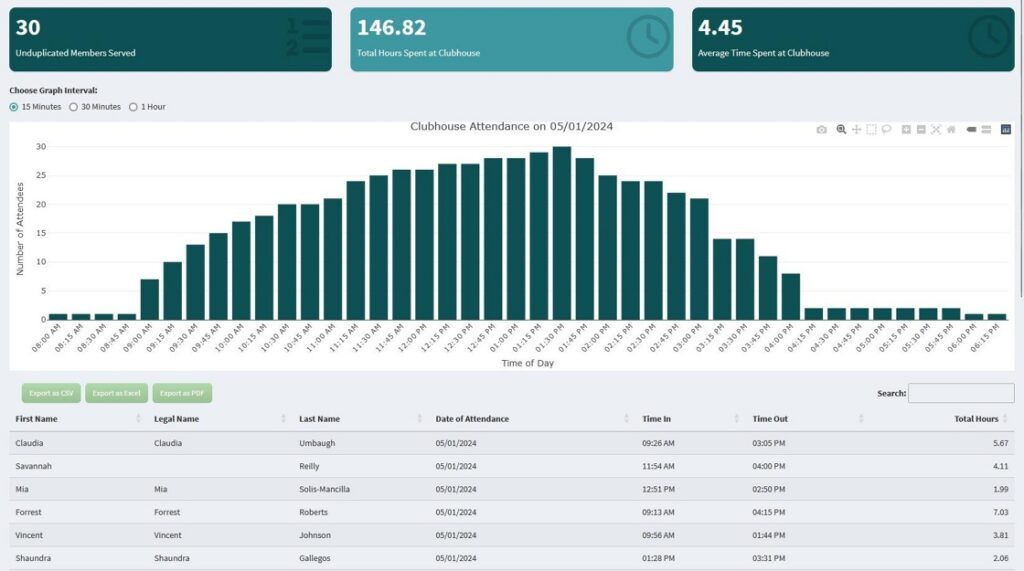
The data, value boxes, and attendance plot will update to show you all data for that single date.
Note: There are only 3 value boxes in this view, instead of 6
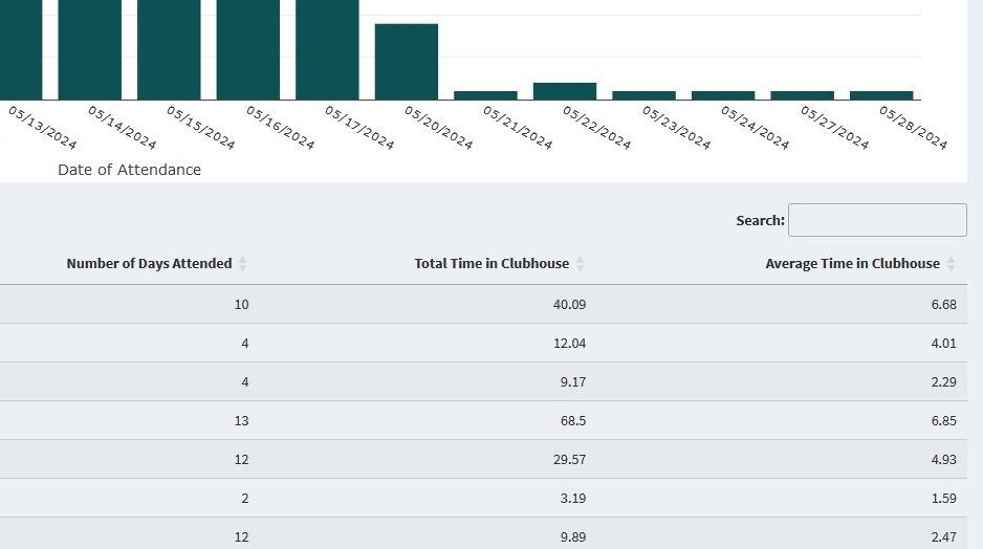
Like the Date Range view, Single Date will also have its own unique columns.
The unique columns for Single Date are:
- Number of Days attended
- Total Time in Clubhouse
- Average Time in Clubhouse
To switch back to a range of dates click on “Date Range”
The Report will remember your last chosen dates when you switch back and forth, so you do not need to change the dates every time you switch between the date options.
An alternative way to get to a Single Date View is to click on that date in the bar chart.
It will take you to a direct view of that specific date.
This can be useful if you notice a certain date that stands out amongst the others and you’d like to investigate.
Attendance Charts #
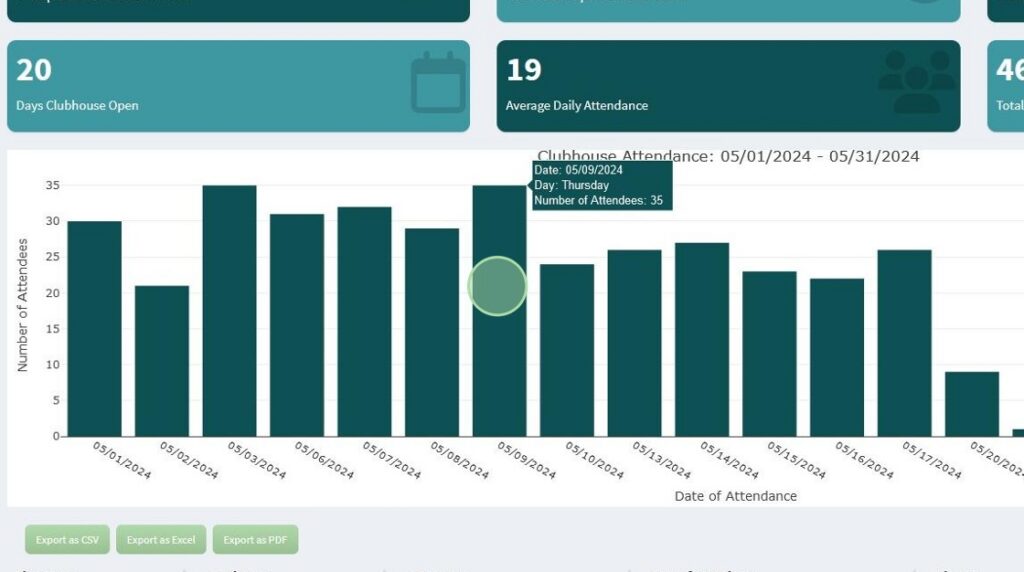
The Attendance Charts can be useful to help you visually recognize patterns of activity in your Clubhouse.
The Date Range chart will show you attendance numbers on each day within that date range.
You can hover over each bar to see the attendance count on that specific day.
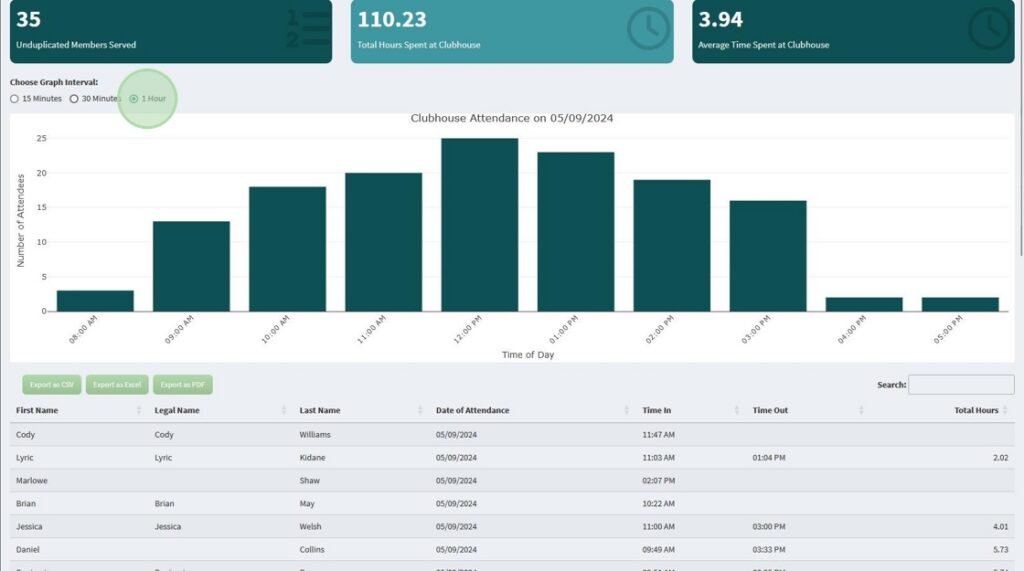
The Single Date Chart works similarly to the Date Range Chart, except it shows time intervals for a single day. It’s handy to show you periods of activity on a normal day in your clubhouse.
It can be shown in 15min, 30min, and 1hr intervals.
Note: Different from the Date Range Chart, clicking on a bar in the Single Date Chart will not change the data in any way.


All Records Vs. Unduplicated #
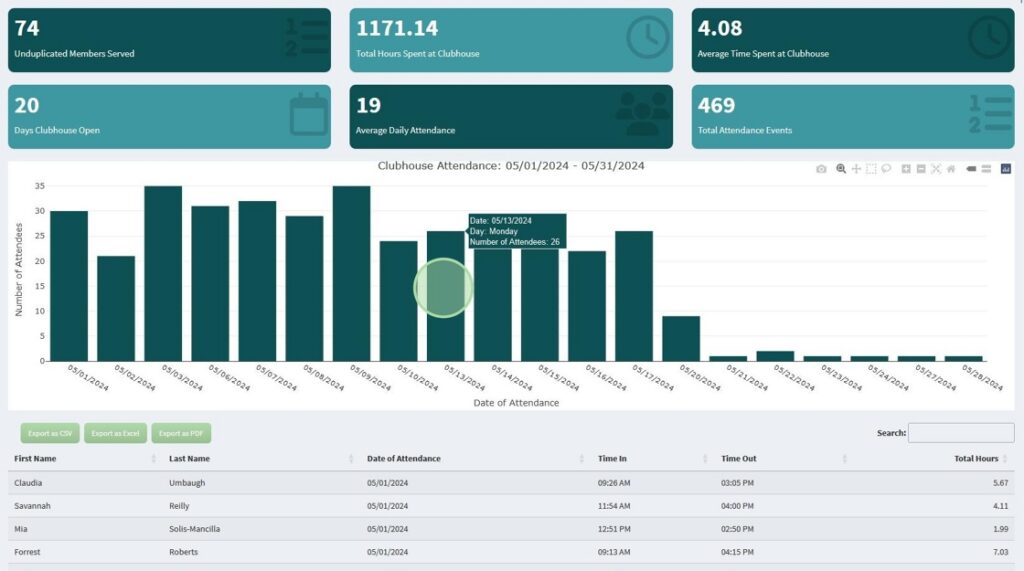
The attendance Report defaults to showing All attendance events for the chosen Date/Date Range.
This will give you A summary of what’s going on in your clubhouse from day to day.
As you can see, for this specified Date Range there are 469 entries and multiple dates of attendance.
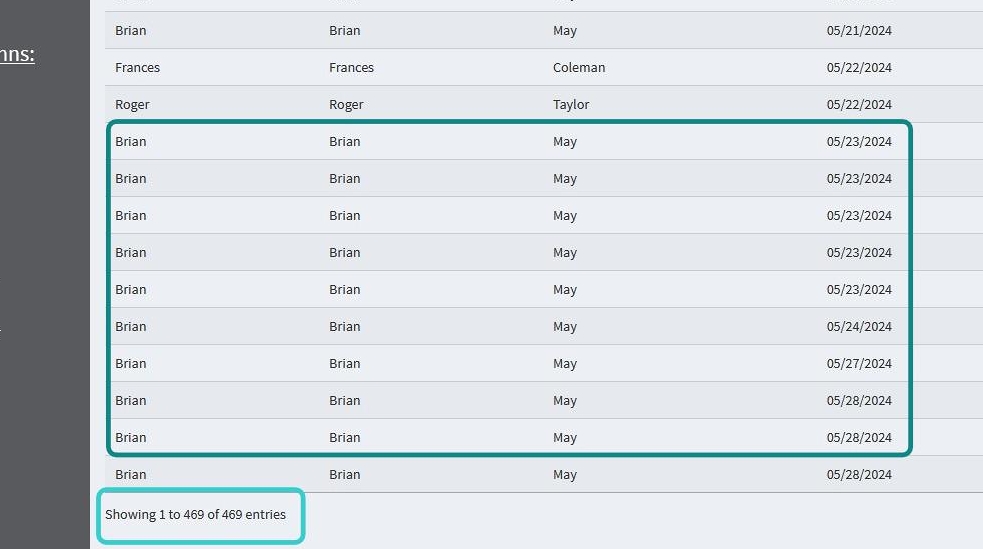
Note: The Unduplicated view will also show multiple records for the same day if they exist. If you need all events combined into a single date for billing purposes we recommend you use the “Billing Report” instead. You can reach out to our team at support@clubhousedata.org to customize the billing report to meet your individual billing needs.
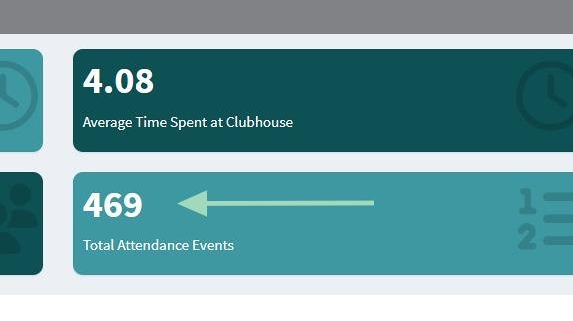
The number of columns will also match up with the “Total Attendance Events” box at the top of the screen.
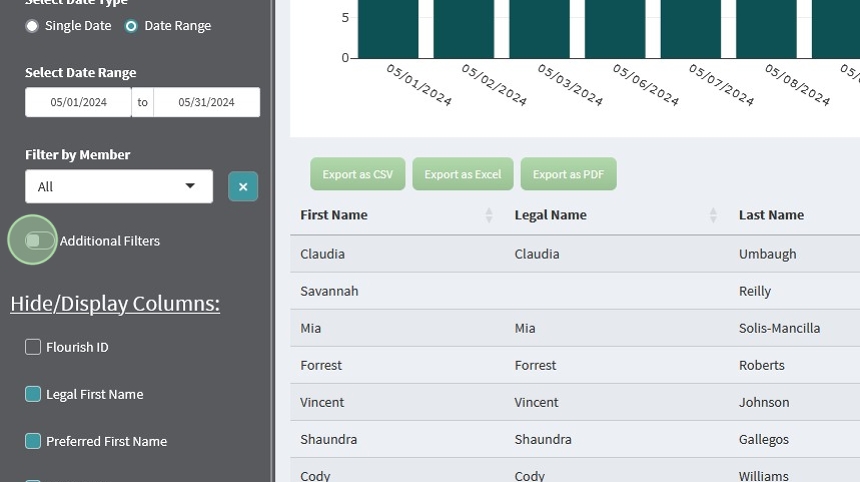
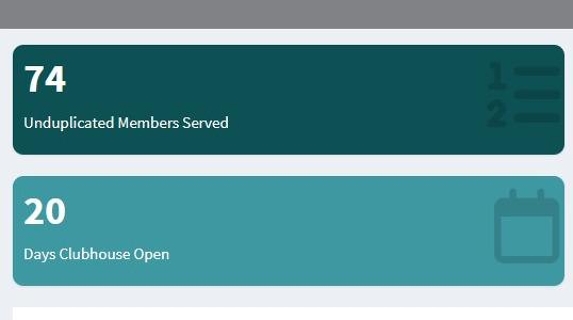
Selecting Unduplicated give you a table of each member who has attended in that time frame, but not individual dates of attendance.

As you can see, the number of entries has reduced to 74, and no members are repeated in the table.
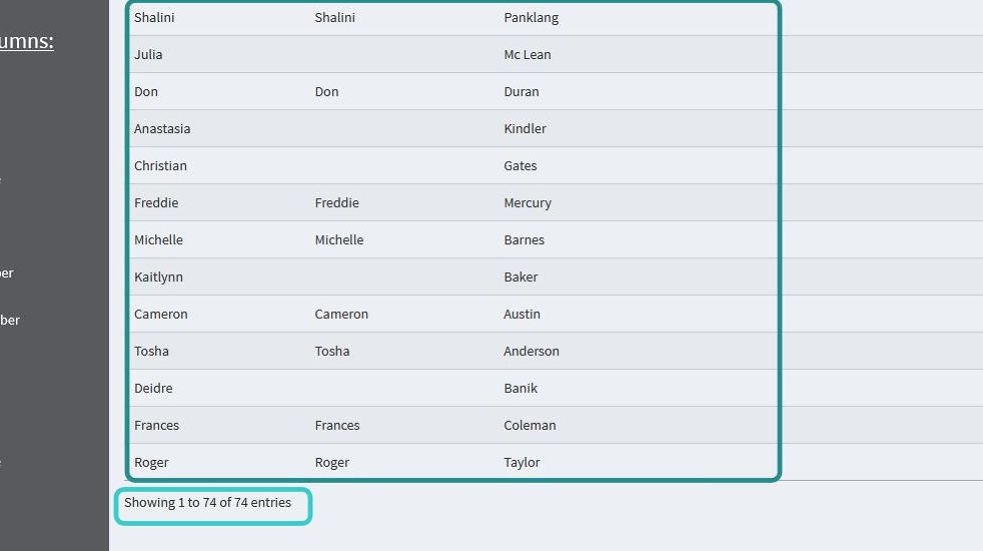
This number will match up with the “Unduplicated Members Served” box at the top of the page.

Filtering by Attendee #
You can see individual attendance records for a specific individual in a data range by using the Filter by Member option.
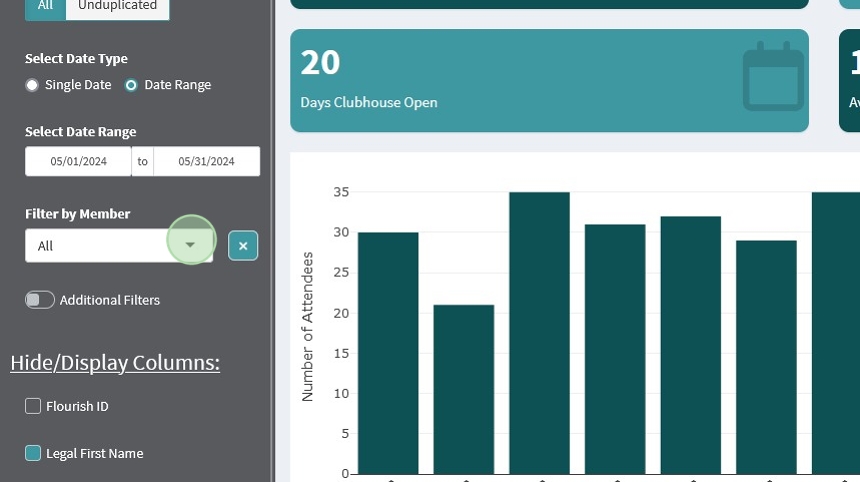
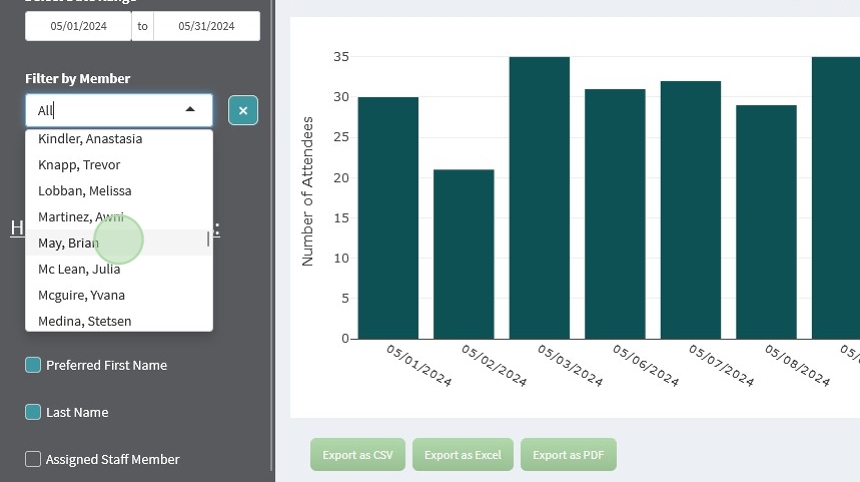
The table and value boxes will update to show you data on the chosen individual
Note: The chart does not change in this view

An alternative way to filter by attendee is to click on one of the attendance events for that attendee. This will filter in the same way that the box on the sidebar does.
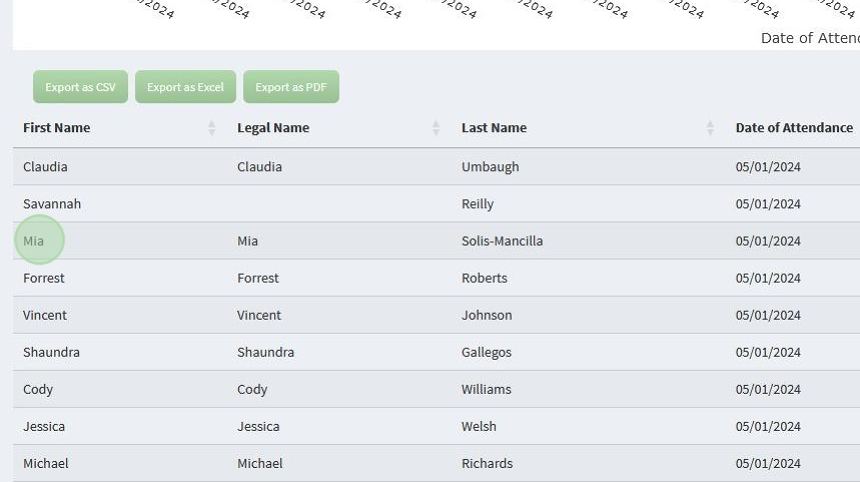
This will update the table in the same way that the box on the sidebar does.

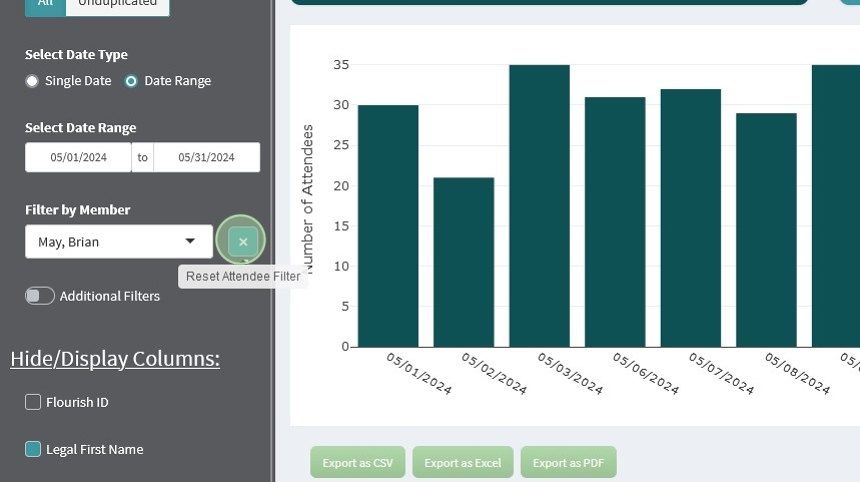
You can clear this filter by clicking the “X” next to it
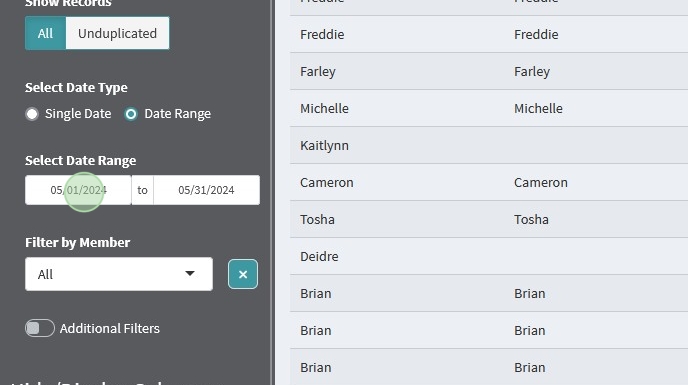
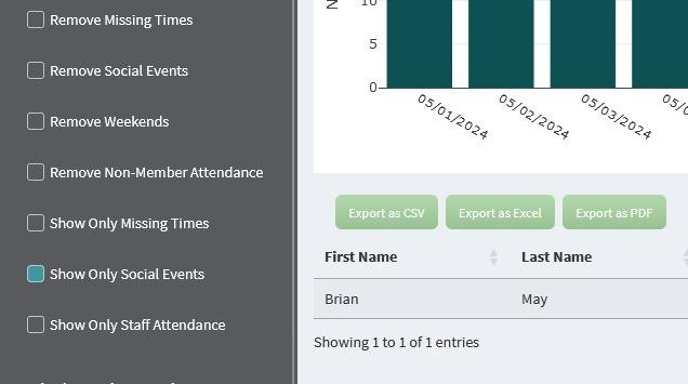
Additional Filters #
These filters are hidden by default because they require a little more care when using them. Some filters will cancel out the another filter, leaving you with no records to show.
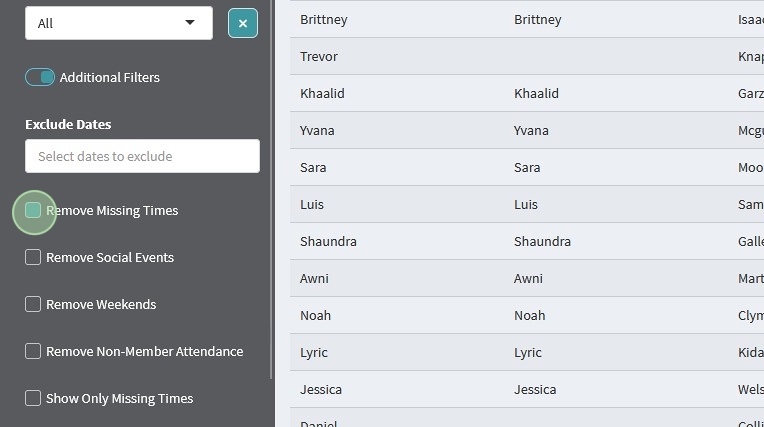
To view the Additional Filters toggle on the option at the bottom of the Filter Menu
Below you will find a brief overview of each filter
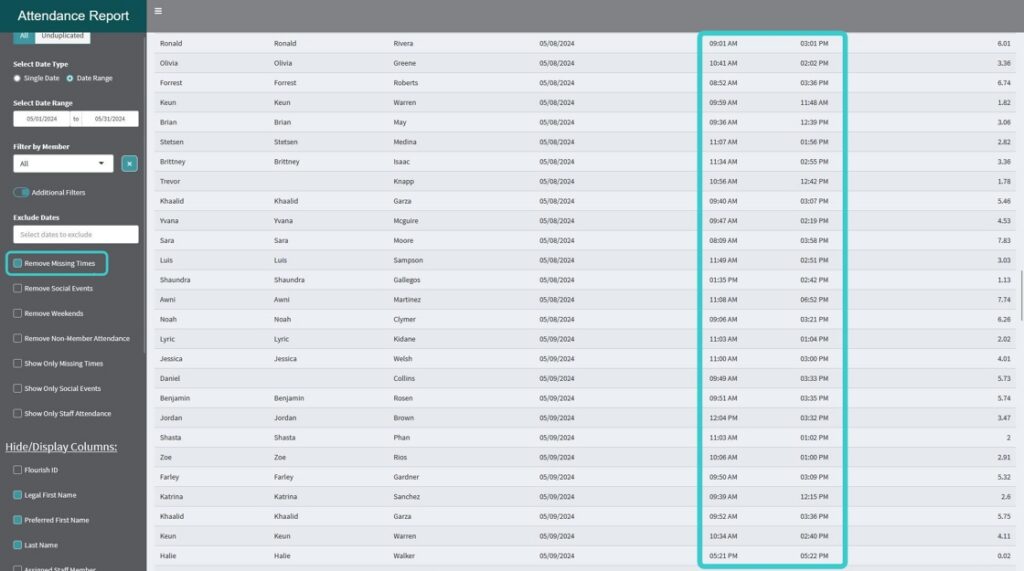
Remove Missing Times
This filter will remove any entry in the data that has an empty entry for time in/out
This filter can not be used at the same time as Show Only Missing Times

Remove Social Events
This will remove attendance events that have been tagged as Socials.
It can help you look at attendance that is specifically Work Ordered Day Attendance
This cannot be used at the same time as the Show Only Social Events filter
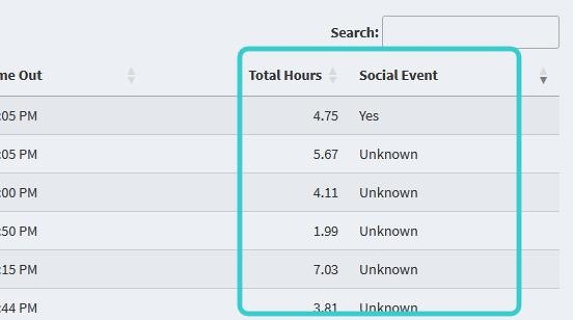

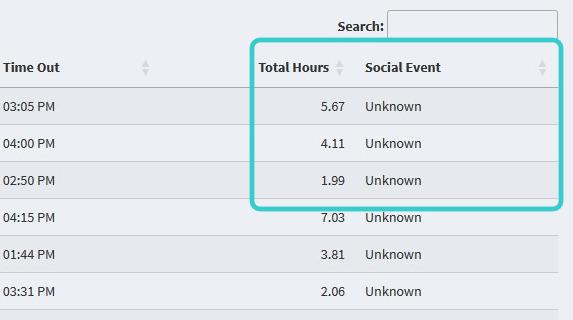
To see the full results of this filter, you may need to turn on the Social Event column and ensure it’s visible.
This is covered in the next section
Remove Weekends
This will remove all attendance records that occur on a Saturday or Sunday
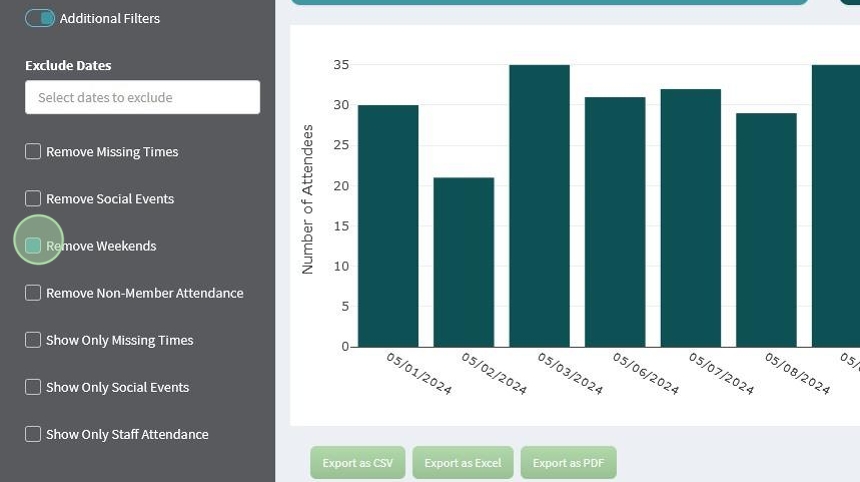
Remove Non-Member Attendance
This will remove anyone who is not listed in Flourish as a Member. This includes Staff, Visitors, Board Members, etc.
This cannot be used at the same time as Show Only Staff Attendance

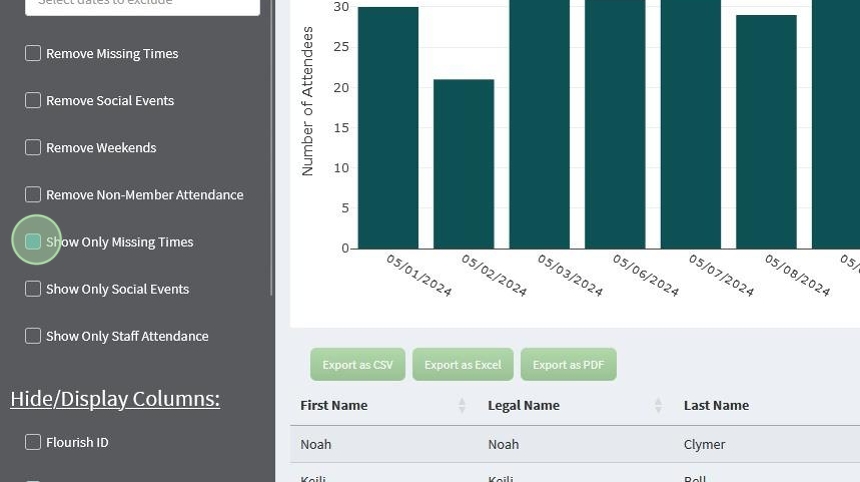
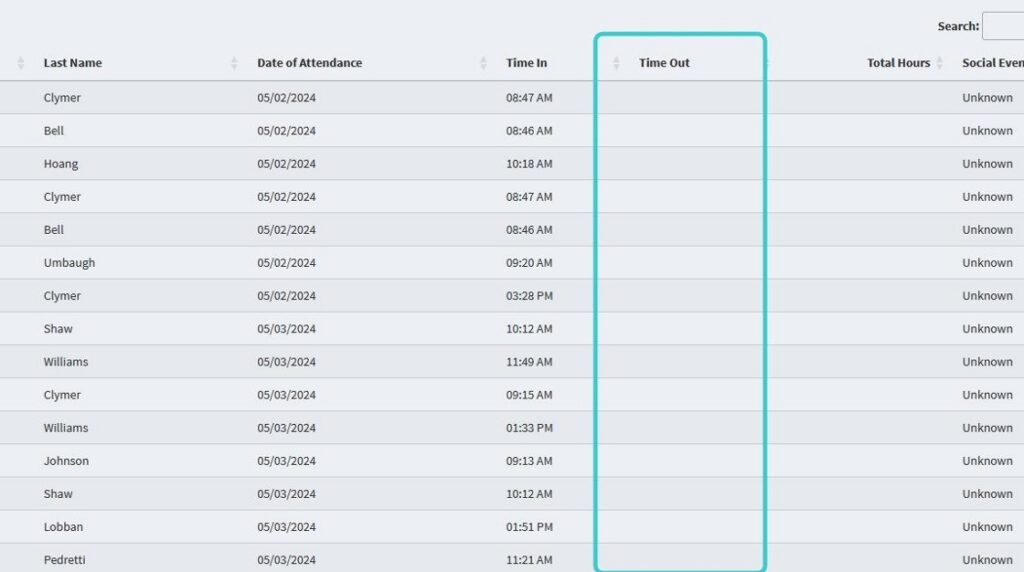
Show Only Missing Times
This will show you ever record that has either a missing Time In or a missing Time out.
This is great to help you identify records that might need to be reviewed and updated.
This cannot be used at the same time as Remove Missing Times
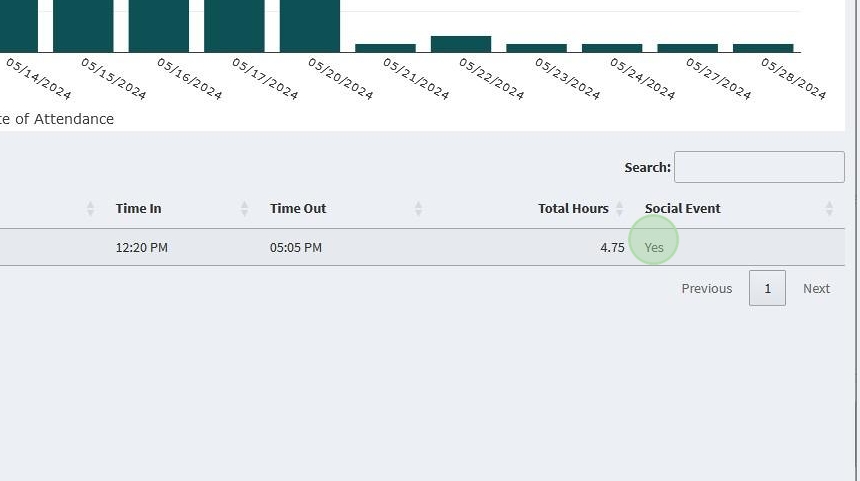
Show Only Social Events
This will show only records marked with a “Yes” in the Social Event column
This cannot be used at the same time as Remove Social Events

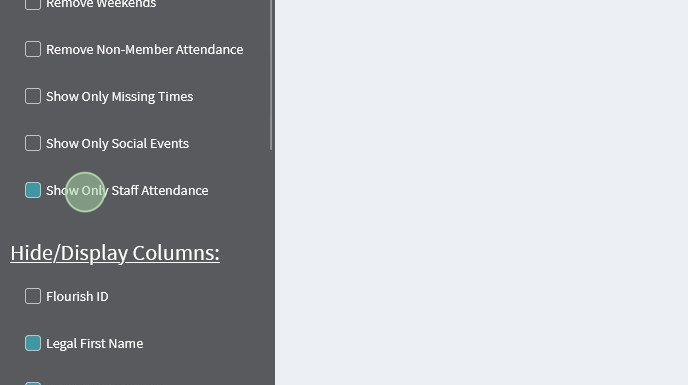
Show Only Staff Attendance
This can help you look at attendance records for just your staff.
This cannot be used at the same time as Remove Non-Member Attendance
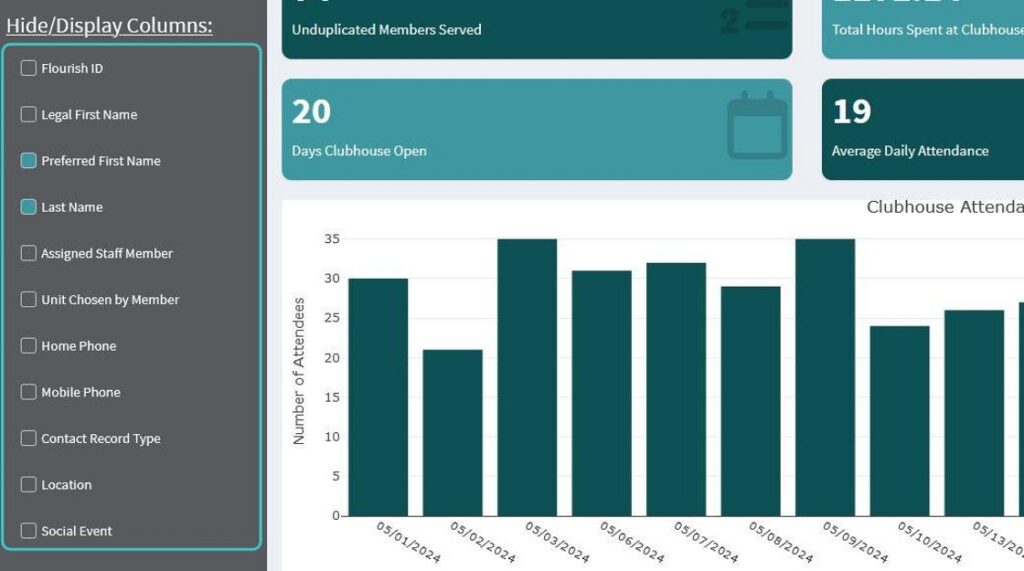
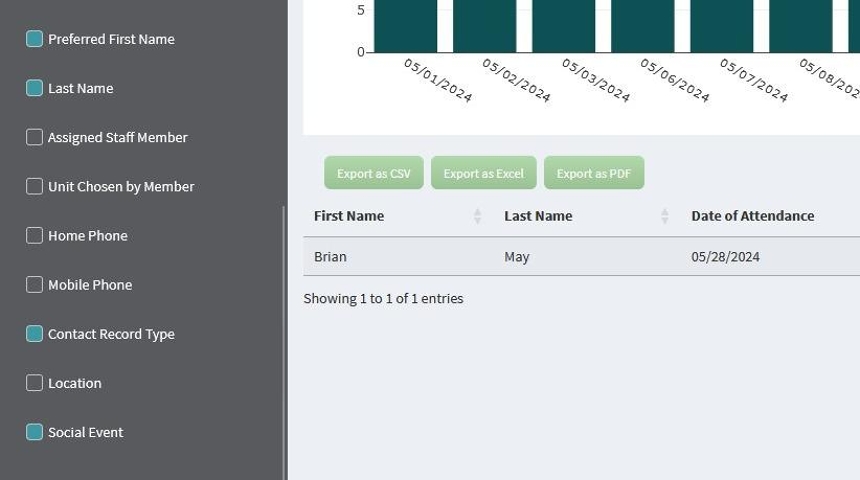
Hide and Display Columns #
You can customize the output of your reports by toggling specific columns on and off.
Not only will your reports display on your screen with your chosen options, but your exports will also carry those same options.
By Default the report only has the following selected:
- Preferred First Name
- Last Name
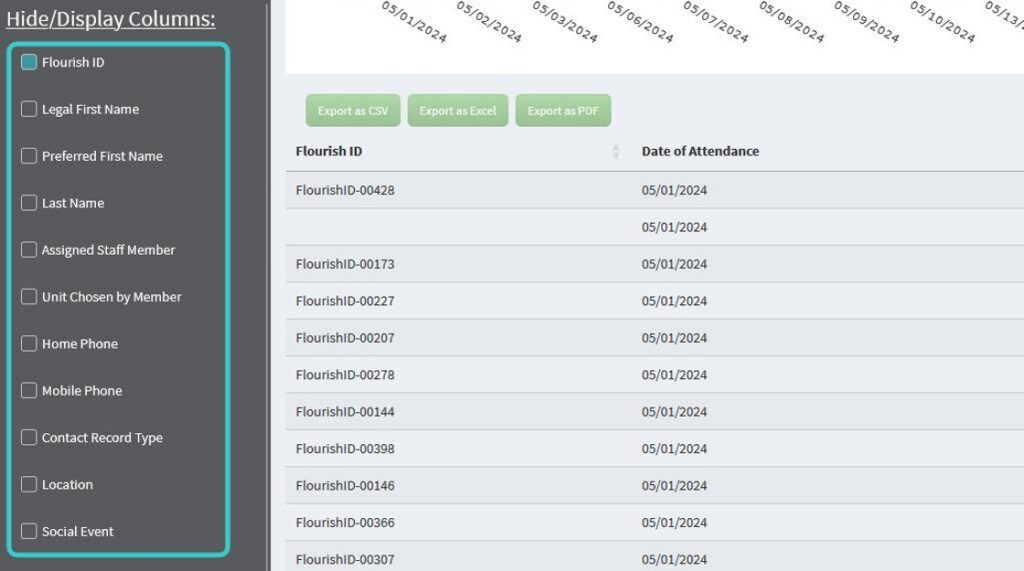
You can quickly de-identify your data by turning on the Flourish ID column and turning of the 3 name columns
This is a great option for reports that need to be shown or sent to external organizations.

Other columns that can be toggled on and off are:
- Assigned Staff Member
- Unit Chosen by Member
- Home Phone
- Mobile Phone
- Contact Record Type
- Location
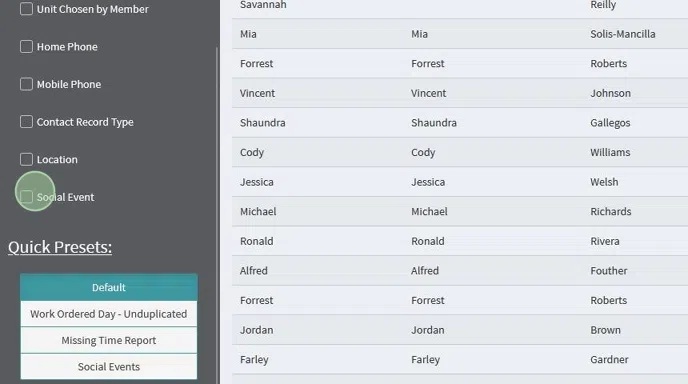
- Social Event
Note: Columns like “Assigned Staff Member” and “Unit Chosen by Member” can be changed to match your clubhouse’s specific terminology. Please reach out to support@clubhousedata.org to make these changes.
Value Boxes #
The Value Boxes are designed to give you quick, “At a Glance” views of common statistics about your clubhouse. They will update with each filter you apply.

They include:
- Unduplicated Members Served
- Days Clubhouse Open
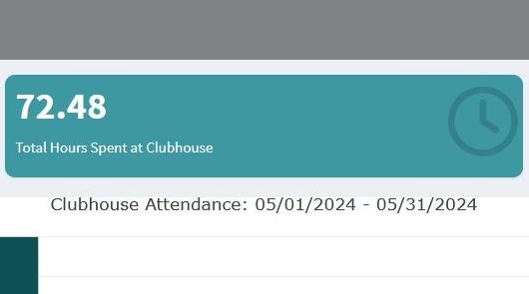
- Total Hours Spend at Clubhouse
- Average Daily Attendance
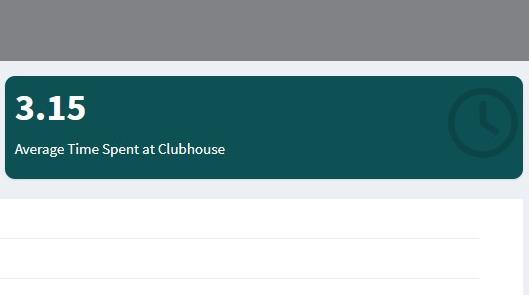
- Average Time Spent at Clubhouse
- Total Attendance Events


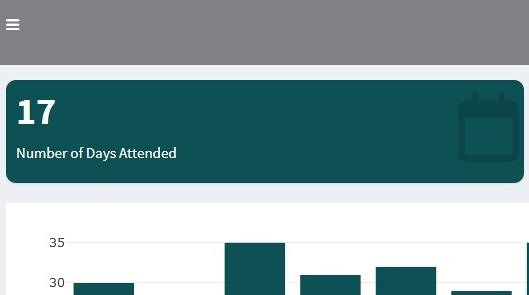
When filtering by a single member the boxes will include:
- Number of Days Attended
- Total Hours Spent at Clubhouse
- Average Time Spent at Clubhouse
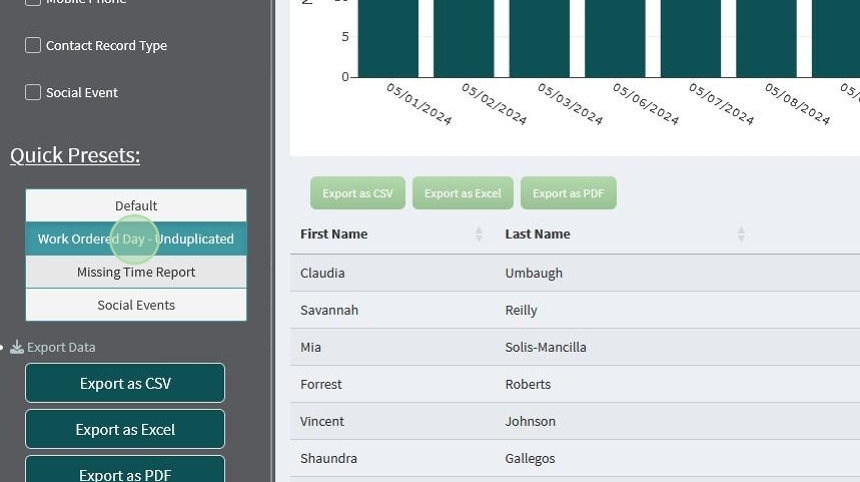
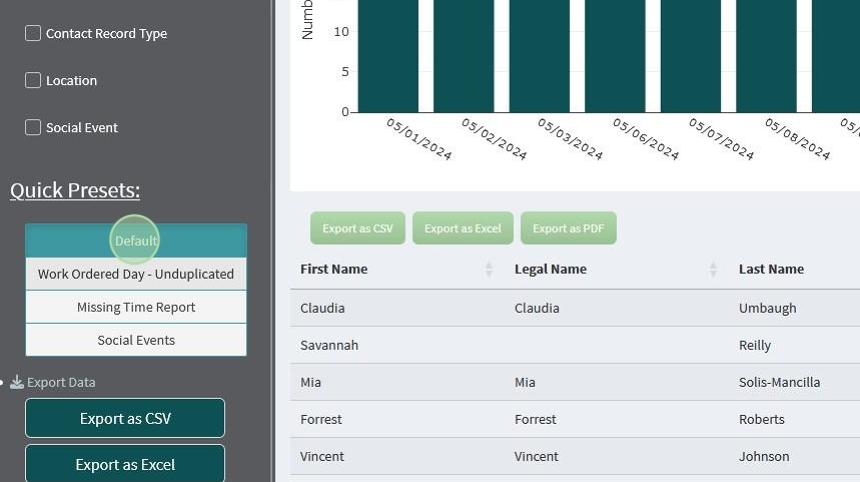
Built in Presets #
Work Ordered Day – Unduplicated
This report selects presets the following filters:
- Unduplicated
- Remove Social Events
- Remove Weekends
- Remove Non-Member Attendance
It also turns on the Default columns.

Missing Time Report
This report presets the following filters:
- All Records
- Show Only Missing Times
It also turns on the Default columns.


To make things easier, we’ve included a few default report options
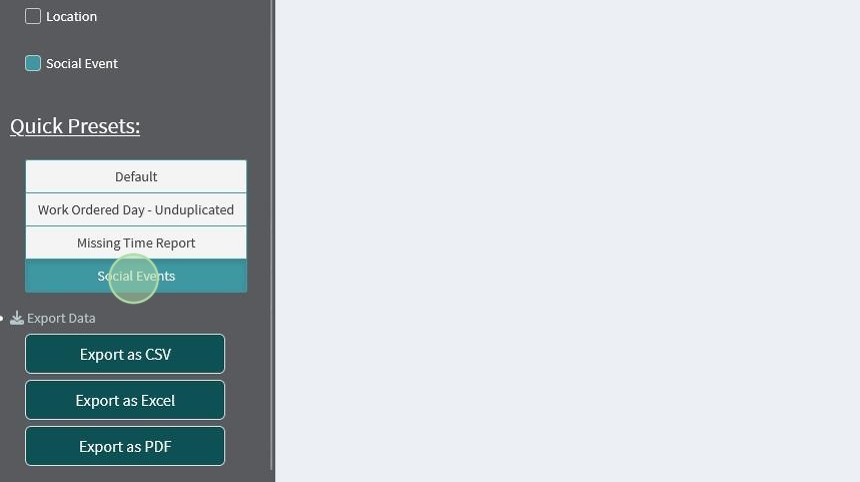
Social Events
This Report presets the following filters:
- All Records
- Show Only Social Events
It also turns on the following columns:
- Default Columns
- Social Events
- Contact Record Type
Default
This sets everything back to the default settings
If you find yourself using a series of settings/filters regularly, please reach out to the Flourish Support team at support@clubhousedata.org
Exporting Reports #
After customizing your report, you can export it in a variety of formats.
Note: This tutorial was made using Mozilla Firefox. Other browsers may look slightly different
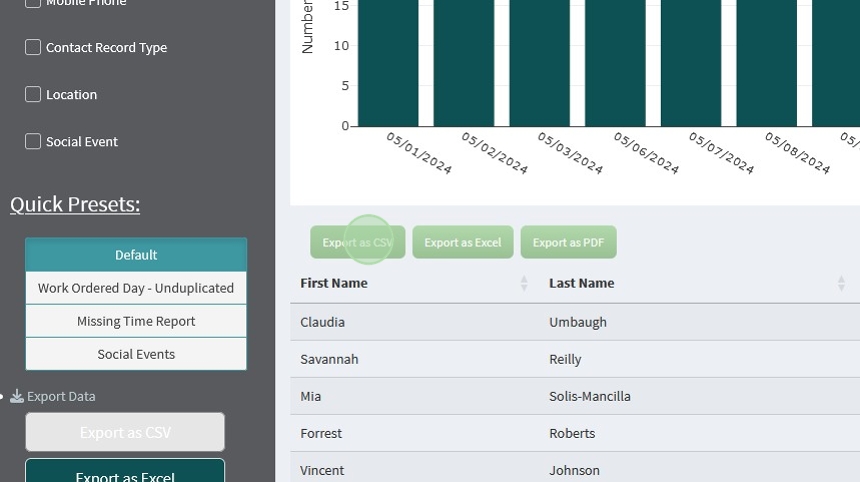
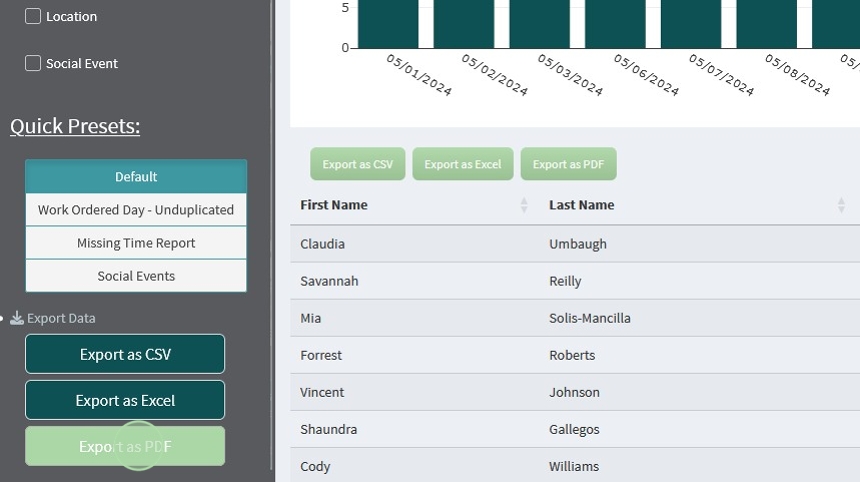
Export as CSV
This is a text based document that can be read in a text editor, Excel, or Google Sheets
These have a variety of uses, including importing into other databases, additional calculations, and/or adding additional information.
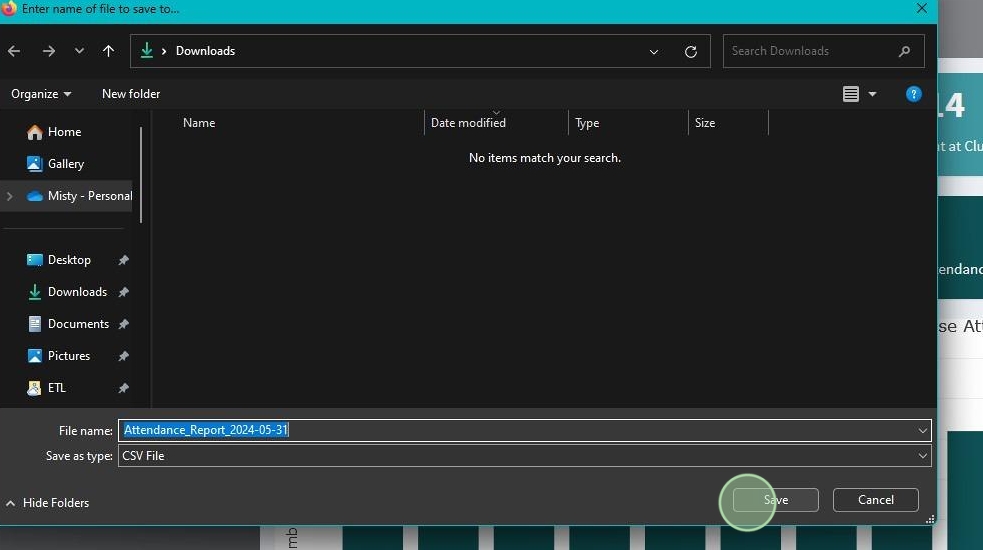
You can use either of the “Export as CSV” buttons to export the table
It will automatically name the file “Attendance Report_[Date]”
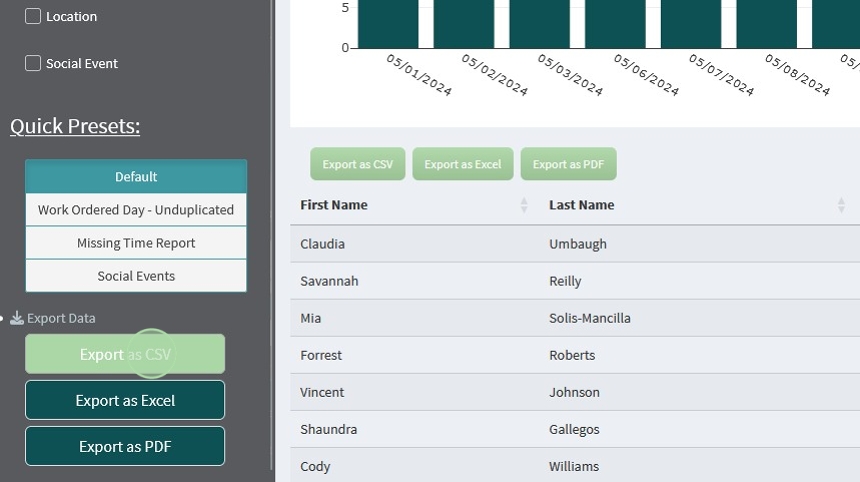
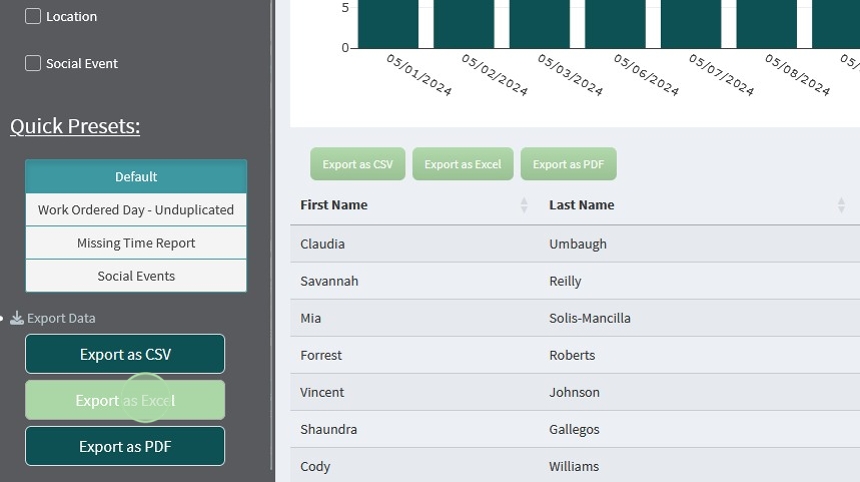
Export as Excel
This is a cell based document that can be read Excel, or Google Sheets*.
These are best if you’d like to do additional calculations or need to include additional information outside of these reports.
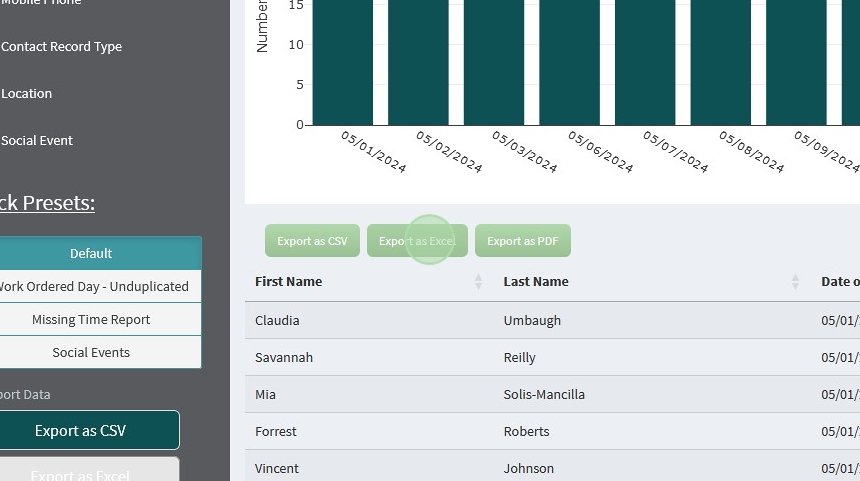
You can use either of the “Export as Excel” buttons to export the table
It will automatically name the file “Attendance Report_[Date]”
*Results in Google Sheets may vary

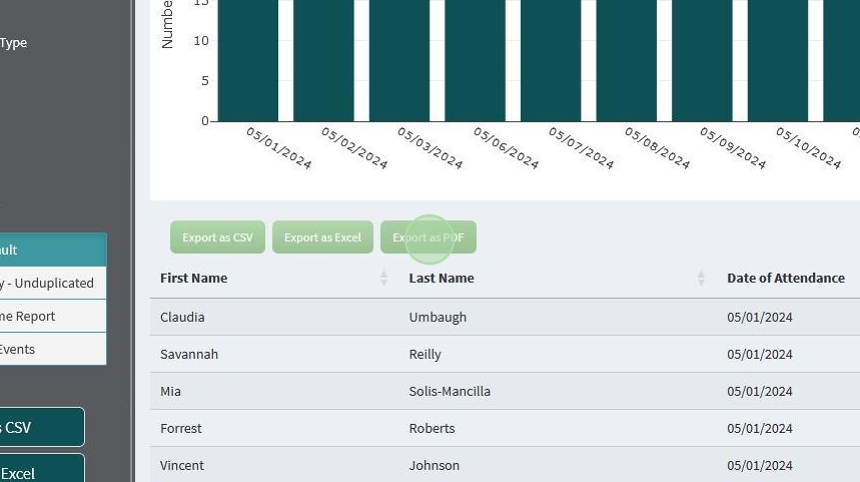
Export as PDF
This is a formatted text based document that can be read in any pdf reader, such as Adobe Acrobat.
These are best used to submit formal/formatted data to outside agencies. This could include state reporting or grant applications.
You can use either of the “Export as PDF” buttons to export the table
It will automatically name the file “Attendance Report_[Date]” and download it to your regular download folder*.
*Depending on your browser, this may vary.

The PDF version of the report will also include the information from the Value Boxes in your online report
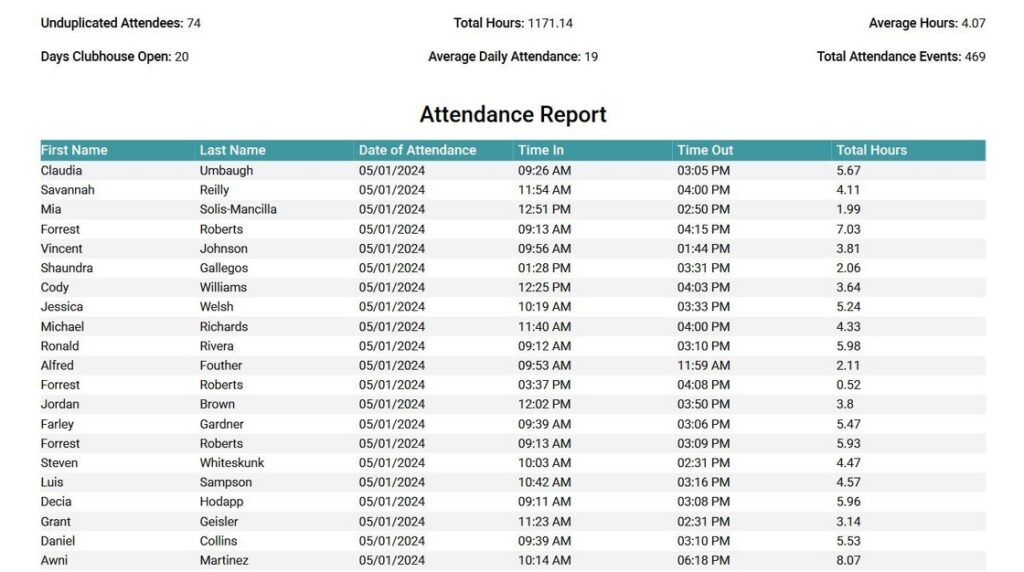
Including a large number of columns in the PDF report may lead to columns spilling off of a single page width. We’ve tried to accommodate for this as much as possible, but cannot account for all combinations of options.
These are downloaded in A4 size, but additional changes to your browser settings or included columns may be needed if you cannot get all columns in a single page width.
Rows will continue on to the next page with no issue.
If you’re experiencing issues with the PDF reports, please reach out to Flourish Support at support@clubhousedata.org